Cold Hardy Palm Tree Zone Map Described

Introduction to the Plant Hardiness Zone Map
This map supersedes
U.S. Department of Agriculture Miscellaneous Publication 814, "Plant Hardiness
Zone Map," which was revised in 1965. This 1990 version shows in
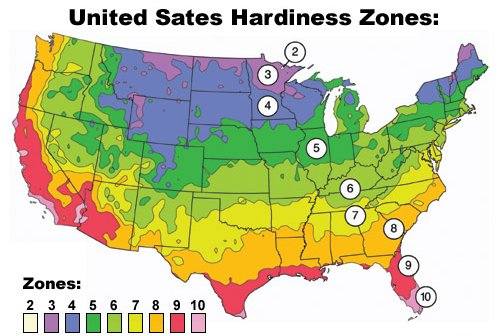
detail the lowest temperatures that can be expected each year in the United
States, Canada, and Mexico. These temperatures are referred to as
"average annual minimum temperatures" and are based on the lowest temperatures
recorded for each of the years 1974 to 1986 in the United States and Canada
and 1971 to 1984 in Mexico. The map shows 10 different zones, each
of which represents an area of winter hardiness for the plants of agriculture
and our natural landscape. It also introduces zone 11 to represent
areas that have average annual minimum temperatures above 40 F (4.4 C)
and that are therefore essentially frost free.
Back
to top
How
to Use the New Map
Zones 2-10 in the map have been subdivided into light- and dark-colored sections
(a and b) that represent 5 F (2.8 C) differences within the 10 F (5.6 C)
zone. The light color of each zone represents the colder section;
the dark color, the warmer section. Zone 11 represents any area where
the average annual minimum temperature is above 40 F (4.4 C). The map shows
20 latitude and longitude lines. Areas above an arbitrary elevation
are traditionally considered unsuitable for plant cropping and do not bear
appropriate zone designations. There are also island zones that,
because of elevation differences, are warmer or cooler than the surrounding
areas and are given a different zone designation. Note that many
large urban areas carry a warmer zone designation than the surrounding
countryside. The map-contains as much detail as possible, considering
the vast amount of data on which it is based and its size.
Back
to top
How the Map Was Started
Every plant can adapt to a range of environments. Gardeners have learned
through experience where the great variety of landscape plants can be grown.
Over the years many schemes have been proposed to help gardeners locate
those environments when they introduce new species, forms, and cultivars.
The pooling of many of these schemes culminated in the development of the
widely used "Plant Hardiness Zone Map," under the supervision of Henry
T. Skinner, the second director of the U.S. National Arboretum. In
cooperation with the American Horticultural Society, he worked with horticultural
scientists throughout the United States to incorporate pertinent horticultural
and meteorological information into the map.
The elements of that map were:
Zones. The contiguous United States and southern Canada were divided into 10 zones
based on a 10 F (5.6 C) difference in average annual minimum temperature.
Winter Hardiness. Survival of landscape plants over winter was selected as the most critical
criterion in their adaptation to the environment.
Classification. The zone ratings were intended to indicate excellent adaptability of the plants.
Many plants may survive in warmer or colder zones. Usually, mere
survival does not represent satisfactory performance.
Interactions With Other Environmental Factors. Many other factors may come into play in determining satisfactory growth.
Wind, soil type, soil moisture, humidity, snow, and winter sunshine may greatly
affect the adaptability of plants.
Interactions With
Cultural Factors. The way plants are placed in the landscape, how they are planted, and their size
and health can greatly influence satisfactory adaptability.
Back
to top
Why the New Map was Created
The "Plant Hardiness Zone Map" was published in 1960 and revised in 1965.
Since then, many changes, new interests, and new responsibilities have
emerged in North American landscaping:
Changes in Weather. We have been losing from our landscapes plants that apparently survived the
1940's to the 1960's. Many of the hardiness zone classifications of plants
are no longer considered valid. In North America, the ranges of
temperature and moisture for the past decade were wider than those recorded for
the 1940's through the 1960's.
Introduction of New Elite Forms. Our landscape industry has worked with plant explorers and breeders to introduce
many new forms of traditional plants that are adapted to a wider range of
environments than the older forms.
Scope. The continental United States is contiguous with Canada to the north and
Mexico to the south. We share more than a common border-we share indigenous
plants and many introduced plants that can be grown successfully. We needed
to expand the scope to include the whole of North America.
Back
to top
How the New Map Was Created
The average annual minimum temperature data were analyzed for Mexico, the United
States, and Canada. Of 14,500 stations that measured temperature
during the period of interest, almost 8,000 could be identified by latitude
and longitude and by a valid average annual minimum temperature (i.e.,
an average based on at least 10 years of data). Data from only the
latter stations were used in the map. The data were archived by Servicio
Meteorologico Nacional (Tucubaya, D.F., Mexico), the National Climatic
Data Center (Asheville, NC), and Environment Canada - Canadian Climate
Centre (Downsville, Ontario). Temperature data were compiled and
maps prepared under contract with the Meteorological Evaluation Services
Co., Inc., 165 Broadway, Amityville, New York 11701. The map
is an Albers Equal Area Projection. Standard parallels of 29.5 ,
and 45.5 , were used to generate the map of the three countries.
The map was computer generated by latitude and longitude. Because
of the large area involved, it is not possible to draw one map that is
accurate for all of North America. The part representing the United
States has the least distortion. The Agricultural Research Service
proposes to periodically evaluate weather data and issue updated maps as
necessary and appropriate.
Back
to top
|